
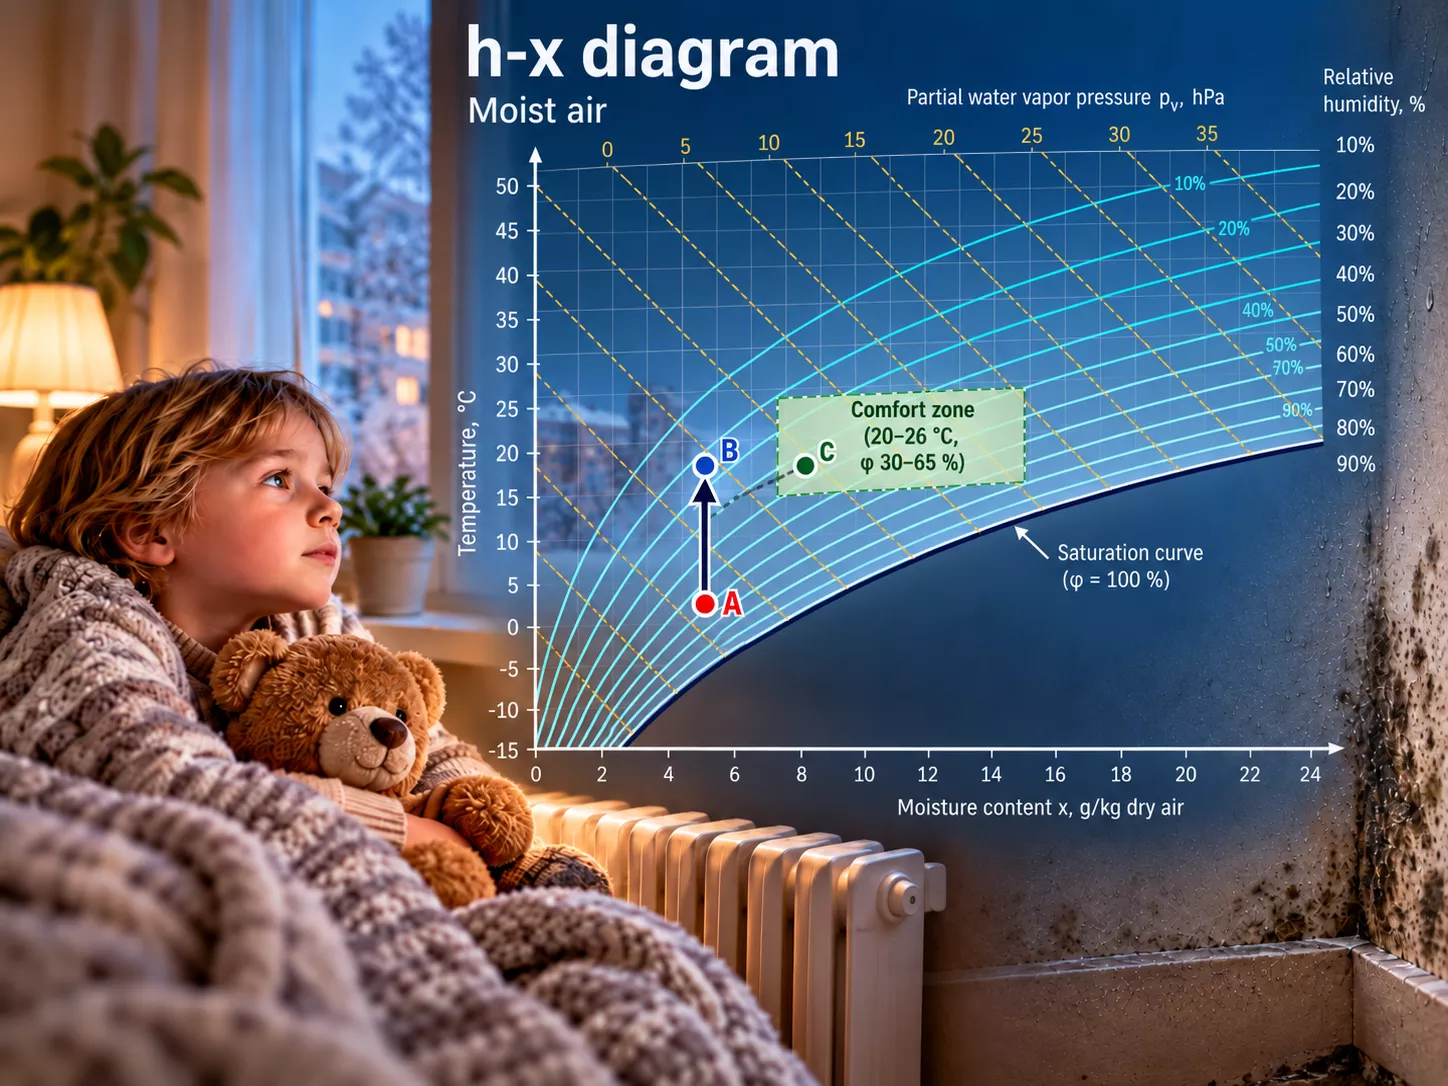
The Mollier h-x diagram shows the state of moist air: temperature, humidity, moisture content and enthalpy in one chart. This interactive calculator places up to six air states on the diagram from their temperature and relative humidity, and works out the dew point, wet-bulb temperature, moisture content, vapour pressure, enthalpy and air density, each at its own air pressure.
You can also follow typical processes step by step:
- heating and cooling,
- mixing of airstreams,
- humidification and dehumidification,
- moisture load in a room,
- heat-recovery ventilation,
- condensation on cold surfaces.
The shaded zones mark the comfort range and the mould-risk range above 80 % relative humidity. This makes it easy to see why a wall corner or window gets damp, and how much ventilation keeps a room healthy. Available in English, German, Russian and Hungarian.
The results are engineering estimates for orientation; they do not replace a professional building-physics assessment.